Cartography
A declarative Auto Layout DSL for Swift <img class="emoji" title=":iphone:" alt=":iphone:" src="https://assets-cdn.github.com/images/icons/emoji/unicode/1f4f1.png" height="20" width="20" align="absmiddle"><img class="emoji" title=":triangular_ruler:" alt=":triangular_ruler:" src="https://assets-cdn.github.com/images/icons/emoji/unicode/1f4d0.png" height="20" width="20" align="absmiddle">
I'm working on a map of the native languages of California for Wikipedia. The map contains areas that each correspond to a language. The original looks like this (click it to see the SVG):
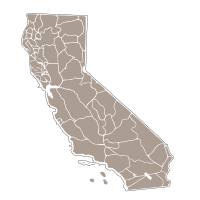
I want to make "locator maps" for each of those individual languages by hand (in Inkscape), like this one, for a language called Cahuilla (which has the language code cah):

Needless to say, doing this would be a pain in the neck if I generated all 60-some by hand in Inkscape.
Worse, whenever I find a mistake in the original, I'd have to redo the whole set of locator maps. (And in fact I recently realized that my original is missing one language entirely. Sorry Cupeño.)
So my goal is to automate this process. I don't have much experience processing SVG or even XML, so I'm looking for recommendations as to which libraries would be most helpful. I'd prefer solutions in Python, sincely I'm not hopeless in that language.
To summarize, I need to:
Get a list of references to all the language shapes in the original SVG file.
For each language in this list:
change the background color of the shape for the current language
put a box around the language
duplicate the box and scale it to a given size (I recognize that in this step it might be difficult to actually "crop" the surrounding shapes as I did in my example -- just creating a box with the language shape on a white background would be sufficient.)
place the duplicate in the upper right corner
save all this stuff in code.svg
The final product will then be 60 SVG files named cah.svg, etc. Better yet, it would be possible to re-generate the whole shebang if it became necessary to edit the original map (which is quite likely).
Source: (StackOverflow)
I am looking for a Visio-like tool that would help me draw my information system at the component level.
The design will not fit on a single piece of paper and I would like a web tool with a sort of 'infinite' sheet of paper, and a proper navigation system.
An idea that crossed my mind for example is to use KML layers on Google Earth to draw the information system and navigate it. I don't know though how easy it would be to do a Visio-like drag and drop editor inside Google Earth.
Have you ever found such a tool? How do you handle bird's eye views of your information system?
Thanks for your help,
Jérôme Wagner
Source: (StackOverflow)
This is specifically a Google Earth API question, but any general geographical solution that can be adapted to it is fine, too.
I'm using the Google Earth API to dynamically put a placemark somewhere on the Earth. Like all placemarks, it has a fixed latitude and longitude. In this case, the altitude is basically always 0. After the placemark is placed, the user may fly the camera around somewhere else and the placemark may not be visible.
What I'd like to be able to do is have a button that would let you automatically look in the direction of the original placemark without changing the camera's position.
In Google Earth API, the user's viewport is represented by a Camera object, which has a latitude and longitude as well as a heading (left-to-right axis) and tilt (up-and-down axis).
So the question can be reduced to: if you have a fixed point on a globe at (lat1, lng1, alt1), how do you calculate the heading and tilt for a camera at (lat1, lng2, alt2) so that it is facing that position?
Source: (StackOverflow)
I'm thinking about some suitable model for storing meridians and parallles. Meridians and parallels should be kept as lines.
Possible models:
A) "Topologic" model
Each point stores pointer to north, south, east and west points.
class Point
{
    private:
            double lat;
            double lon;
            Point *north;
            Point *south;
            Point *east;
            Point *west;
            ...
};

class Meridian
{
    private:
            double longitude;
            Point *start;
            Point  *end;
            unsigned int points_total;
};

class Parallel
{
    private:
            double latitude;
            Point *start;
            Point  *end;
            unsigned int points_total;
};
Pros:
- We can traverse each meridian in north-south direction and vice versa. We can traverse each parallel in east-west direction and vice versa.
- We determine whether each point is inside meridian or parallel (using pointers).
- Small storage requirements...
Cons:
- Only sequential access to every meridian/parallel point
- Problems with copy constructors and operator =. A copy of a set of points should be done in several phases: Create a new instance of points, adding topological relations between points using std::map, change the endpoints of the meridian/parallel... It is rather slow...
The second disadvantage has led me to abandon the model.
B) List of points. Meridian/parallel stores list of points, there are no topological relationship.
class Point
{
    private:
            double lat;
            double lon;
};

class Meridian
{
    private:
            double longitude;
            std::vector <Point> points;
};

class Parallel
{
    private:
            double latitude;
            std::vector <Point> points;
};
Pros:
- We can traverse each meridian in north-south direction and vice versa. We can traverse each parallel in east-west direction and vice versa.
- No problems with copy constructors and operator =
- Sequential and direct access to every point.
Cons:
- We can not determine whether each point belongs to any meridian/parallel (using pointers) or not.
- Larger storage requirements.
- At any point we are not able to find previous / next point of the meridian / parallel, we do not have pointers...
The last disadvantage could lead to the abandonment of a model and leads me to think about a modified variant of topological model....
I am performing some spatial simulations and representing results in several cartografic projections, so efficient data storage is very important for me.
Maybe someone could propose a better model :-). Thanks for your answers...
Source: (StackOverflow)
I'm currently trying to produce two maps, one with multiple categoric values and one with continous numeric values, as in:
link
I have a dataset which provides the NPA and the two informations for each NPA: the item (category) and the Frequency (on a scale from 1 to 10):
NPA     item           Frequency
1000    huitante        0
1002    huitante        10
1006    quatre-vingt    3
2000    huitante        9
I have as well a specific shapefile for the country I work on (Switzerland). On a previous post, I found some interesting code, that I copy/paste here:
# open the shapefile
require(rgdal)
require(rgeos)
require(ggplot2)
ch <- readOGR(work.dir, layer = "PLZO_PLZ")

# convert to data frame for plotting with ggplot - takes a while
ch.df <- fortify(ch)

# generate fake data and add to data frame
ch.df$count <- round(runif(nrow(ch.df), 0, 100), 0)

# plot with ggplot
ggplot(ch.df, aes(x = long, y = lat, group = group, fill = count)) +
geom_polygon(colour = "black", size = 0.3, aes(group = group)) +
theme()
the author gives in comment some information to plot a specific dataset (and not fake data):
# plot just a subset of NPAs using ggplot
my.sub <- ch.df[ch.df$id %in% c(4,6), ]
ggplot(my.sub, aes(x = long, y = lat, group = group, fill = count)) +
geom_polygon(colour = "black", size = 0.3, aes(group = group)) +
theme()
And says in the comment of the post to :
replace ggplot(my.sub, aes(x = long, y = lat, group = group, fill = count))
with ggplot(my.sub, aes(x = long, y = lat, group = group, fill = frequency))
So I guess I need to extract frequency as a variable
frequency <- table(data$frequency)
And change in the code as indicated in the quote.
Unfortunately, my problem is that it does not work, I get the following comment :
Don't know how to automatically pick scale for object of type table.
Defaulting to continuous
Error: Aesthetics must either be length one, or the same length as the
dataProblems:frequency
My questions are :
- how can I change the code to include my own data, and plot the numeric value (frequency)
- how can I change the code to include my own data, and plot categoric value (item)
I don t need to represent frequency and item on the same map, just know how to create to seprated maps.
My dataset is in this file, with as well the shapefile I need to use.
https://www.dropbox.com/sh/5x6r6s2obfztblm/AAAesIOrxn76HU57AIF0y1Oua?dl=0
Any help will be really appreciated!
Source: (StackOverflow)
I am getting strange results from using d3 to render a GeoJSON of railroad data. The file is very large, 38M, so I include one piece of it: https://gist.github.com/amiri/8202105.
Here is my code: https://gist.github.com/amiri/8202126
Of course the most important bit is the last lines at the bottom.
I see the shapes, but the lines are not drawn properly. Rather, there is some sort of filling going on between points of the line segments. Here is a screenshot:
http://snag.gy/n2A2W.jpg
Does anyone have any idea what is going on? I converted the data to topojson to see whether that might clear up my problem, but I got the same results. Is this a CSS problem, perhaps?
Source: (StackOverflow)
Using urllib to make my API call to CartdoDB (per Andrew Hill's example here). I'm getting a successful '200' in response, and can get the script to print out my JSON response, but my problem is the map doesn't update after making this SELECT statement. Am I missing a step in order for that to happen?
Thanks!
Ben
import urllib
import urllib2
import json

username = '[MY USER NAME]'
apikey = '[MY API KEY]'
query = 'SELECT * FROM map_census_acs2012_ct WHERE (population > 8000 AND population <= 26908)'

url = "https://[MY USER NAME].cartodb.com/api/v1/sql"

# prams object that holds our api key and query.
params = {
    'api_key' : apikey,
    'q'       : query
}

req = urllib2.Request(url, urllib.urlencode(params))
res = urllib2.urlopen(req)
res.getcode()
Source: (StackOverflow)
I uploaded a shape file to cartodb
then I exported it as a csv
Now I want to load it from the csv file (I'm studying how to generate a csv like that from other sources)
I have a geojson strng column with all the info of the geometry (a polygon)
then I try to update the_geom with a query like this:
update paisprov2012 set
the_geom = st_setsrid(st_geomfromgeojson(geojson),4326)
And I get this error:
ERROR: Geometry type (MultiPolygon) does not match column type (Point)
SO I try with
ALTER TABLE paisprov2012 ALTER COLUMN the_geom TYPE Polygon using the_geom::Polygon
But I get a
ERROR: cannot cast type geometry to polygon
Any idea?
Source: (StackOverflow)
I need some advice about how to improve the visualization of cartographic information.
User can select different species and the webmapping app shows its geographical distribution (polygonal degree cells), each specie with a range of color (e.g darker orange color where we find more info, lighter orange where less info).
The problem is when more than one specie overlaps. What I am currently doing is just to calculate the additive color mix of two colors using http://www.xarg.org/project/jquery-color-plugin-xcolor/
As you can see in the image below, the resulting color where two species overlap (mixed blue and yellow) is not intuitive at all.

Someone has any idea or knows similar tools where to get inspiration? for creating the polygons I use d3.js, so if more complex SVG features have to be created I can give a try.
Some ideas I had are...
1) The more data on a polygon, the thicker the border (or each part of the border with its corresponding color)
2) add a label at the center of polygon saying how many species overlap.
3) Divide polygon in different parts, each one with corresponding species color.
thanks in advance,
Pere
Source: (StackOverflow)
I have a view which I want to look like this:
|---------------|
|               | <- navBar
|---------------|
|               | <- topView
|---------------|
|               |
|               |
|               |
|---------------|
Everything I want is to stick topView.top to navBar.bottom. I've decided to go with Cartography and implemented following code (trying to stick to MVC ofc):
In my UIViewController subclass:
override func viewWillLayoutSubviews() {
    super.viewWillLayoutSubviews()

    aView?.topLayoutGuide = self.topLayoutGuide // where aView is my subclass of UIView, inserted in loadView method
}
In my UIView subclass:
var topLayoutGuide: UILayoutSupport?

override func updateConstraints() {
    var constraint = NSLayoutConstraint?()
    layout(topView) { (topView) in
        constraint = topView.top == topView.superview!.top
    }
    topView.superview!.removeConstraint(constraint!)

    layout(topView) { topView in
        topView.top == topView.superview!.top + (self.topLayoutGuide?.length ?? 0)
        topView.height == 67
        topView.left == topView.superview!.left
        topView.width == topView.superview!.width
    }

    super.updateConstraints()
}
The problem is that I receive following logs and I have no idea how to fix it:
Unable to simultaneously satisfy constraints.
[...]
(
    "<NSLayoutConstraint:0x7fe6a64e4800 V:|-(64)-[UIView:0x7fe6a6505d80]   (Names: '|':MyApp.MyView:0x7fe6a360d4c0 )>",
    "<NSLayoutConstraint:0x7fe6a3538a80 V:|-(0)-[UIView:0x7fe6a6505d80]   (Names: '|':MyApp.MyView:0x7fe6a360d4c0 )>"
)
Seems I need some help. How to do it properly? I don't want to implement constraints in UIViewController and I don't want to use Storyboards.
Thanks for any help!
Source: (StackOverflow)
Im looking to create a map that can be interactive.
The best option that I found is leaflet, the thing is I don't find any resource explaining how to create my own map.
Im looking to create a mall map where user can see all the stores, fountain ...
How could I achieve that ?
Source: (StackOverflow)
I have no idea how to set constrant.height to constant value:
override func updateConstraints() {
    layout(view) { view in
        let viewHeight = 67

        view.top == view.superview!.top
        view.left == view.superview!.left
        view.height == viewHeight // Error: Binary operator '==' cannot be applied to operands of type 'Dimension' and 'Int'
        view.width == view.superview!.width
    }

    super.updateConstraints()
}
This should be simple, put as a Swift newbie atm I don't have any working idea, would welcome any help :)
Source: (StackOverflow)
Topojson's doc states:
You can specify ESRI shapefiles as input:
topojson -o output.json input.shp
My .shp file is valid, npm and topojson are installed, and I'am in the input file's directory (cd). This topojson command simply doesn't work on my side, no output, nor feedback produced.
How do you convert shp into topojson on your side ?
which topojson gives /usr/local/bin/topojson
which ogr2ogr gives /usr/bin/ogr2ogr
On ubuntu 13.04, but I think my issue is not related to ubuntu.
Source: (StackOverflow)
I want to plot kind of isarhytmoc points map like in this tutorial, but with population data.
However, unfortunately, I have no enough skill and only came with such code:
require(sp)
require(rgdal)
require(RColorBrewer)
require(ggplot2)
library(plyr)
library(maptools)
library(rgeos)
require(gpclib)
gpclibPermitStatus()
gpclibPermit()


rus<-url("http://www.filefactory.com/file/4h1hb5c1cw7r/n/RUS_adm1_RData")
print(load(rus))
proj4.str <- CRS("+init=epsg:3413 +lon_0=105")
gadm.prj <- spTransform(gadm, proj4.str)


popul <- read.csv2(file="C:\\unempl11.txt", header = TRUE,
        sep = ";",quote = "", dec=",", stringsAsFactors=F)

df <- fortify(gadm.prj, region = "ID_1")
df2 <- merge(df, gadm.prj, by.x="id", by.y="ID_1")


p <- ggplot(df2, aes(x = long, y = lat, group=group)) +
       geom_point(data    = popul,
                  mapping = aes(x=lon, y=lat, colour=abs),
                  size    = 3,
                  alpha   = 0.8) +
       scale_colour_gradient2(name  = "Population",
                              low   = "darkred",
                              mid   = "white",
                              high  = "blue",
                              guide = "colorbar") +
       ggtitle("Population in Russia)")
p + geom_path(data    = df2,
               mapping = aes(x=long, y=lat, group=group),
              size    = 0.125)
Here is the data I use, if anyone can help me with some ideas i will be grateful.
Source: (StackOverflow)
I put together a toy example below.
My question is, how can I added coastlines (much like you can get from the maps package to the faceted plots below?
I can do this with contour() and filled.contour(), but I'm not sure of how to go about this with ggplot2-style plotting when using facet layers. I have no problem plotting coasts when I have a single plot.
You can download the netCDF file "sst.mon.anom.nc" from NOAA here (~ 10mb).
library(ncdf4)
library(ggplot2)
library(reshape)

# The data is 5x5 degree reconstructed sea-surface temperature anomalies.
# Exciting stuff.
sst <- ncvar_get(nc = nc_open("sst.mon.anom.nc"),
                 varid = "sst",
                 start = c(1, 1, 1),
                 count = c(-1, -1, -1))

# Drawing out four layers from the sst array.
d1 <- melt(sst[, , 1])
d1$drought <- rep("d1", dim(d1)[1])
d3 <- melt(sst[, , 3])
d3$drought <- rep("d3", dim(d3)[1])
d5 <- melt(sst[, , 5])
d5$drought <- rep("d5", dim(d5)[1])
d6 <- melt(sst[, , 6])
d6$drought <- rep("d6", dim(d6)[1])

# Combining the layers into a single data.frame:
d <- rbind(d1, d3, d5, d6)
names(d) <- c("lon", "lat", "ERSST", "layer")

p <- ggplot(data = d, aes(x = lon, y = lat, fill = ERSST))
print(p + geom_tile() +
      scale_fill_gradient2(high = "red", low = "blue") +
      facet_wrap(~ layer) )

Many thanks!
P.S. Also, I just noticed that the color legend ordering is upside down. Hmm...
Source: (StackOverflow)